Identifying App Installations

[The contents of this post grew out of an internal discussion featuring many of the usual suspects who’ve been authors in this space. — Tim Bray]

In the Android group, from time to time we hear complaints from developers about problems they’re having coming up with reliable, stable, unique device identifiers. This worries us, because we think that tracking such identifiers isn’t a good idea, and that there are better ways to achieve developers’ goals.

Tracking Installations


It is very common, and perfectly reasonable, for a developer to want to track individual installations of their apps. It sounds plausible just to call TelephonyManager.getDeviceId() and use that value to identify the installation. There are problems with this
: First, it doesn’t work reliably (see below). Second, when it does work, that value survives device wipes (“Factory resets”) and thus you could end up making a nasty mistake when one of your customers wipes their device and passes it on to another person.

To track installations, you could for example use a UUID as an identifier, and simply create a new one the first time an app runs after installation. Here is a sketch of a class named “Installation” with one static method Installation.id(Context context). You could imagine writing more installation-specific data into the INSTALLATION file.

public class Installation {
private static String sID = null;
private static final String INSTALLATION = "INSTALLATION";

public synchronized static String id(Context context) {
if (sID == null) {
File installation = new File(context.getFilesDir(), INSTALLATION);
try {
if (!installation.exists())
writeInstallationFile(installation);
sID = readInstallationFile(installation);
} catch (Exception e) {
throw new RuntimeException(e);
}
}
return sID;
}

private static String readInstallationFile(File installation) throws IOException {
RandomAccessFile f = new RandomAccessFile(installation, "r");
byte[] bytes = new byte[(int) f.length()];
f.readFully(bytes);
f.close();
return new String(bytes);
}

private static void writeInstallationFile(File installation) throws IOException {
FileOutputStream out = new FileOutputStream(installation);
String id = UUID.randomUUID().toString();
out.write(id.getBytes());
out.close();
}
}

Identifying Devices

Suppose you feel that for the needs of your application, you need an actual hardware device identifier. This turns out to be a tricky problem.

In the past, when every Android device was a phone, things were simpler: TelephonyManager.getDeviceId() is required to return (depending on the network technology) the IMEI, MEID, or ESN of the phone, which is unique to that piece of hardware.

However, there are problems with this approach:

  • Non-phones: Wifi-only devices or music players that don’t have telephony hardware just don’t have this kind of unique identifier.


  • Persistence: On devices which do have this, it persists across device data wipes and factory resets. It’s not clear at all if, in this situation, your app should regard this as the same device.


  • Privilege:It requires READ_PHONE_STATE permission, which is irritating if you don’t otherwise use or need telephony.


  • Bugs: We have seen a few instances of production phones for which the implementation is buggy and returns garbage, for example zeros or asterisks.


Mac Address

It may be possible to retrieve a Mac address from a device’s WiFi or Bluetooth hardware. We do not recommend using this as a unique identifier. To start with, not all devices have WiFi. Also, if the WiFi is not turned on, the hardware may not report the Mac address.

Serial Number

Since Android 2.3 (“Gingerbread”) this is available via android.os.Build.SERIAL. Devices without telephony are required to report a unique device ID here; some phones may do so also.

ANDROID_ID

More specifically, Settings.Secure.ANDROID_ID. This is a 64-bit quantity that is generated and stored when the device first boots. It is reset when the device is wiped.

ANDROID_ID seems a good choice for a unique device identifier. There are downsides: First, it is not 100% reliable on releases of Android prior to 2.2 (“Froyo”). Also, there has been at least one widely-observed bug in a popular handset from a major manufacturer, where every instance has the same ANDROID_ID.

Conclusion

For the vast majority of applications, the requirement is to identify a particular installation, not a physical device. Fortunately, doing so is straightforward.

There are many good reasons for avoiding the attempt to identify a particular device. For those who want to try, the best approach is probably the use of ANDROID_ID on anything reasonably modern, with some fallback heuristics for legacy devices.

In-app Billing Launched on Android Market

[This post is by Eric Chu, Android Developer Ecosystem. —Dirk Dougherty]

Today, we're pleased to announce the launch of Android Market In-app Billing to developers and users. As an Android developer, you will now be able to publish apps that use In-app Billing and your users can make purchases from within your apps.

In-app Billing gives you more ways to monetize your apps with try-and-buy, virtual goods, upgrades, and other billing models. If you aren’t yet familiar with In-app Billing, we encourage you to learn more about it.

Several apps launching today are already using the service, including Tap Tap Revenge by Disney Mobile; Comics by ComiXology; Gun Bros, Deer Hunter Challenge HD, and WSOP3 by Glu Mobile; and Dungeon Defenders: FW Deluxe by Trendy Entertainment.

To try In-app Billing in your apps, start with the detailed documentation and complete sample app provided, which show how to implement the service in your app, set up in-app product lists in Android Market, and test your implementation. Also, it’s absolutely essential that you review the security guidelines to make sure your billing implementation is secure.

We look forward to seeing how you’ll use this new service in your apps!

In-App Billing on Android Market: Ready for Testing

[This post is by Eric Chu, Android Developer Ecosystem. —Dirk Dougherty]

Back in January we announced our plan to introduce Android Market In-app Billing this quarter. We're pleased to let you know that we will be launching In-app Billing next week.

In preparation for the launch, we are opening up Android Market for upload and end-to-end testing of your apps that use In-app Billing. You can now upload your apps to the Developer Console, create a catalog of in-app products, and set prices for them. You can then set up accounts to test in-app purchases. During these test transactions, the In-app Billing service interacts with your app exactly as it will for actual users and live transactions.

Note that although you can upload apps during this test development phase, you won’t be able to actually publish the apps to users until the full launch of the service next week.


To get you started, we’ve updated the developer documentation with information about how to set up product lists and test your in-app products. Also, it is absolutely essential that you review the security guidelines to make sure your billing implementation is secure.

We encourage you start uploading and testing your apps right away.

Memory Analysis for Android Applications

[This post is by Patrick Dubroy, an Android engineer who writes about programming, usability, and interaction on his personal blog. — Tim Bray]

The Dalvik runtime may be garbage-collected, but that doesn't mean you can ignore memory management. You should be especially mindful of memory usage on mobile devices, where memory is more constrained. In this article, we're going to take a look at some of the memory profiling tools in the Android SDK that can help you trim your application's memory usage.

Some memory usage problems are obvious. For example, if your app leaks memory every time the user touches the screen, it will probably trigger an OutOfMemoryError eventually and crash your app. Other problems are more subtle, and may just degrade the performance of both your app (as garbage collections are more frequent and take longer) and the entire system.

Tools of the trade

The Android SDK provides two main ways of profiling the memory usage of an app: the Allocation Tracker tab in DDMS, and heap dumps. The Allocation Tracker is useful when you want to get a sense of what kinds of allocation are happening over a given time period, but it doesn't give you any information about the overall state of your application's heap. For more information about the Allocation Tracker, see the article on Tracking Memory Allocations. The rest of this article will focus on heap dumps, which are a more powerful memory analysis tool.

A heap dump is a snapshot of an application's heap, which is stored in a binary format called HPROF. Dalvik uses a format that is similar, but not identical, to the HPROF tool in Java. There are a few ways to generate a heap dump of a running Android app. One way is to use the Dump HPROF file button in DDMS. If you need to be more precise about when the dump is created, you can also create a heap dump programmatically by using the android.os.Debug.dumpHprofData() function.

To analyze a heap dump, you can use a standard tool like jhat or the Eclipse Memory Analyzer (MAT). However, first you'll need to convert the .hprof file from the Dalvik format to the J2SE HPROF format. You can do this using the hprof-conv tool provided in the Android SDK. For example:

hprof-conv dump.hprof converted-dump.hprof

Example: Debugging a memory leak

In the Dalvik runtime, the programmer doesn't explicitly allocate and free memory, so you can't really leak memory like you can in languages like C and C++. A "memory leak" in your code is when you keep a reference to an object that is no longer needed. Sometimes a single reference can prevent a large set of objects from being garbage collected.

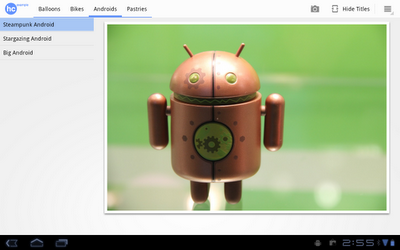
Let's walk through an example using the Honeycomb Gallery sample app from the Android SDK. It's a simple photo gallery application that demonstrates how to use some of the new Honeycomb APIs. (To build and download the sample code, see the instructions.) We're going to deliberately add a memory leak to this app in order to demonstrate how it could be debugged.

Imagine that we want to modify this app to pull images from the network. In order to make it more responsive, we might decide to implement a cache which holds recently-viewed images. We can do that by making a few small changes to ContentFragment.java. At the top of the class, let's add a new static variable:

private static HashMap<String,Bitmap> sBitmapCache = new HashMap<String,Bitmap>();

This is where we'll cache the Bitmaps that we load. Now we can change the updateContentAndRecycleBitmap() method to check the cache before loading, and to add Bitmaps to the cache after they're loaded.

void updateContentAndRecycleBitmap(int category, int position) {
if (mCurrentActionMode != null) {
mCurrentActionMode.finish();
}

// Get the bitmap that needs to be drawn and update the ImageView.

// Check if the Bitmap is already in the cache
String bitmapId = "" + category + "." + position;
mBitmap = sBitmapCache.get(bitmapId);

if (mBitmap == null) {
// It's not in the cache, so load the Bitmap and add it to the cache.
// DANGER! We add items to this cache without ever removing any.
mBitmap = Directory.getCategory(category).getEntry(position)
.getBitmap(getResources());
sBitmapCache.put(bitmapId, mBitmap);
}
((ImageView) getView().findViewById(R.id.image)).setImageBitmap(mBitmap);
}

I've deliberately introduced a memory leak here: we add Bitmaps to the cache without ever removing them. In a real app, we'd probably want to limit the size of the cache in some way.

Examining heap usage in DDMS

The Dalvik Debug Monitor Server (DDMS) is one of the primary Android debugging tools. DDMS is part of the ADT Eclipse plug-in, and a standalone version can also be found in the tools/ directory of the Android SDK. For more information on DDMS, see Using DDMS.

Let's use DDMS to examine the heap usage of this app. You can start up DDMS in one of two ways:

  • from Eclipse: click Window > Open Perspective > Other... > DDMS
  • or from the command line: run ddms (or ./ddms on Mac/Linux) in the tools/ directory

Select the process com.example.android.hcgallery in the left pane, and then click the Show heap updates button in the toolbar. Then, switch to the VM Heap tab in DDMS. It shows some basic stats about our heap memory usage, updated after every GC. To see the first update, click the Cause GC button.

We can see that our live set (the Allocated column) is a little over 8MB. Now flip through the photos, and watch that number go up. Since there are only 13 photos in this app, the amount of memory we leak is bounded. In some ways, this is the worst kind of leak to have, because we never get an OutOfMemoryError indicating that we are leaking.

Creating a heap dump

Let's use a heap dump to track down the problem. Click the Dump HPROF file button in the DDMS toolbar, choose where you want to save the file, and then run hprof-conv on it. In this example, I'll be using the standalone version of MAT (version 1.0.1), available from the MAT download site.

If you're running ADT (which includes a plug-in version of DDMS) and have MAT installed in Eclipse as well, clicking the “dump HPROF” button will automatically do the conversion (using hprof-conv) and open the converted hprof file into Eclipse (which will be opened by MAT).

Analyzing heap dumps using MAT

Start up MAT and load the converted HPROF file we just created. MAT is a powerful tool, and it's beyond the scope of this article to explain all it's features, so I'm just going to show you one way you can use it to detect a leak: the Histogram view. The Histogram view shows a list of classes sortable by the number of instances, the shallow heap (total amount of memory used by all instances), or the retained heap (total amount of memory kept alive by all instances, including other objects that they have references to).

If we sort by shallow heap, we can see that instances of byte[] are at the top. As of Android 3.0 (Honeycomb), the pixel data for Bitmap objects is stored in byte arrays (previously it was not stored in the Dalvik heap), and based on the size of these objects, it's a safe bet that they are the backing memory for our leaked bitmaps.

Right-click on the byte[] class and select List Objects > with incoming references. This produces a list of all byte arrays in the heap, which we can sort based on Shallow Heap usage.

Pick one of the big objects, and drill down on it. This will show you the path from the root set to the object -- the chain of references that keeps this object alive. Lo and behold, there's our bitmap cache!

MAT can't tell us for sure that this is a leak, because it doesn't know whether these objects are needed or not -- only the programmer can do that. In this case, the cache is using a large amount of memory relative to the rest of the application, so we might consider limiting the size of the cache.

Comparing heap dumps with MAT

When debugging memory leaks, sometimes it's useful to compare the heap state at two different points in time. To do this, you'll need to create two separate HPROF files (don't forget to convert them using hprof-conv).

Here's how you can compare two heap dumps in MAT (it's a little complicated):

  1. Open the first HPROF file (using File > Open Heap Dump).
  2. Open the Histogram view.
  3. In the Navigation History view (use Window > Navigation History if it's not visible), right click on histogram and select Add to Compare Basket.
  4. Open the second HPROF file and repeat steps 2 and 3.
  5. Switch to the Compare Basket view, and click Compare the Results (the red "!" icon in the top right corner of the view).

Conclusion

In this article, I've shown how the Allocation Tracker and heap dumps can give you get a better sense of your application's memory usage. I also showed how The Eclipse Memory Analyzer (MAT) can help you track down memory leaks in your app. MAT is a powerful tool, and I've only scratched the surface of what you can do with it. If you'd like to learn more, I recommend reading some of these articles:

Application Stats on Android Market

[This post is by Eric Chu, Android Developer Ecosystem. —Dirk Dougherty]

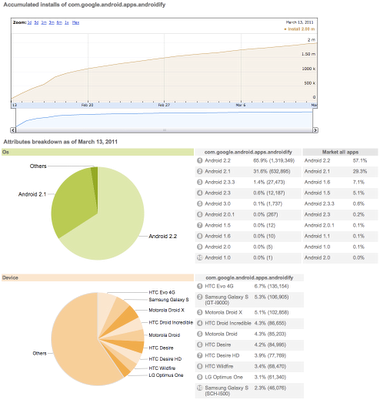
On the Android Market team, it’s been our goal to bring you improved ways of seeing and understanding the installation performance of your published applications. We know that this information is critical in helping you tune your development and marketing efforts. Today I’m pleased to let you know about an important new feature that we’ve added to Android Market called Application Statistics.

Application Statistics is a new type of dashboard in the Market Developer Console that gives you an overview of the installation performance of your apps. It provides charts and tables that summarize each app’s active installation trend over time, as well as its distribution across key dimensions such as Android platform versions, devices, user countries, and user languages. For additional context, the dashboard also shows the comparable aggregate distribution for all app installs from Android Market (numbering in the billions). You could use this data to observe how your app performs relative to the rest of Market or decide what to develop next.


To start with, we’ve seeded the application Statistics dashboards with data going back to December 22, 2010. Going forward, we’ll be updating the data daily.

We encourage you to check out these new dashboards and we hope they’ll give you new and useful insights into your apps’ installation performance. You can access the Statistics dashboards from the main Listings page in the Developer Console.

Watch for more announcements soon. We are continuing to work hard to deliver more reporting features to help you manage your products successfully on Android Market.

Android 3.0 Hardware Acceleration

[This post is by Romain Guy, who likes things on your screen to move fast. —Tim Bray]

One of the biggest changes we made to Android for Honeycomb is the addition of a new rendering pipeline so that applications can benefit from hardware accelerated 2D graphics. Hardware accelerated graphics is nothing new to the Android platform, it has always been used for windows composition or OpenGL games for instance, but with this new rendering pipeline applications can benefit from an extra boost in performance. On a Motorola Xoom device, all the standard applications like Browser and Calendar use hardware-accelerated 2D graphics.

In this article, I will show you how to enable the hardware accelerated 2D graphics pipeline in your application and give you a few tips on how to use it properly.

Go faster

To enable the hardware accelerated 2D graphics, open your AndroidManifest.xml file and add the following attribute to the <application /> tag:

    android:hardwareAccelerated="true"

If your application uses only standard widgets and drawables, this should be all you need to do. Once hardware acceleration is enabled, all drawing operations performed on a View's Canvas are performed using the GPU.

If you have custom drawing code you might need to do a bit more, which is in part why hardware acceleration is not enabled by default. And it's why you might want to read the rest of this article, to understand some of the important details of acceleration.

Controlling hardware acceleration

Because of the characteristics of the new rendering pipeline, you might run into issues with your application. Problems usually manifest themselves as invisible elements, exceptions or different-looking pixels. To help you, Android gives you 4 different ways to control hardware acceleration. You can enable or disable it on the following elements:

  • Application

  • Activity

  • Window

  • View

To enable or disable hardware acceleration at the application or activity level, use the XML attribute mentioned earlier. The following snippet enables hardware acceleration for the entire application but disables it for one activity:

    <application android:hardwareAccelerated="true">
<activity ... />
<activity android:hardwareAccelerated="false" />
</application>

If you need more fine-grained control, you can enable hardware acceleration for a given window at runtime:

    getWindow().setFlags(
WindowManager.LayoutParams.FLAG_HARDWARE_ACCELERATED,
WindowManager.LayoutParams.FLAG_HARDWARE_ACCELERATED);

Note that you currently cannot disable hardware acceleration at the window level. Finally, hardware acceleration can be disabled on individual views:

    view.setLayerType(View.LAYER_TYPE_SOFTWARE, null);

Layer types have many other usages that will be described later.

Am I hardware accelerated?

It is sometimes useful for an application, or more likely a custom view, to know whether it currently is hardware accelerated. This is particularly useful if your application does a lot of custom drawing and not all operations are properly supported by the new rendering pipeline.

There are two different ways to check whether the application is hardware accelerated:

If you must do this check in your drawing code, it is highly recommended to use Canvas.isHardwareAccelerated() instead of View.isHardwareAccelerated(). Indeed, even when a View is attached to a hardware accelerated window, it can be drawn using a non-hardware accelerated Canvas. This happens for instance when drawing a View into a bitmap for caching purpose.

What drawing operations are supported?

The current hardware accelerated 2D pipeline supports the most commonly used Canvas operations, and then some. We implemented all the operations needed to render the built-in applications, all the default widgets and layouts, and common advanced visual effects (reflections, tiled textures, etc.) There are however a few operations that are currently not supported, but might be in a future version of Android:

  • Canvas
    • clipPath

    • clipRegion

    • drawPicture

    • drawPoints

    • drawPosText

    • drawTextOnPath

    • drawVertices


  • Paint
    • setLinearText

    • setMaskFilter

    • setRasterizer


In addition, some operations behave differently when hardware acceleration enabled:

  • Canvas
    • clipRect: XOR, Difference and ReverseDifference clip modes are ignored; 3D transforms do not apply to the clip rectangle

    • drawBitmapMesh: colors array is ignored

    • drawLines: anti-aliasing is not supported

    • setDrawFilter: can be set, but ignored


  • Paint
    • setDither: ignored

    • setFilterBitmap: filtering is always on

    • setShadowLayer: works with text only


  • ComposeShader
    • A ComposeShader can only contain shaders of different types (a BitmapShader and a LinearGradientShader for instance, but not two instances of BitmapShader)

    • A ComposeShader cannot contain a ComposeShader


If drawing code in one of your views is affected by any of the missing features or limitations, you don't have to miss out on the advantages of hardware acceleration for your overall application. Instead, consider rendering the problematic view into a bitmap or setting its layer type to LAYER_TYPE_SOFTWARE. In both cases, you will switch back to the software rendering pipeline.

Dos and don'ts

Switching to hardware accelerated 2D graphics is a great way to get smoother animations and faster rendering in your application but it is by no means a magic bullet. Your application should be designed and implemented to be GPU friendly. It is easier than you might think if you follow these recommendations:

  • Reduce the number of Views in your application: the more Views the system has to draw, the slower it will be. This applies to the software pipeline as well; it is one of the easiest ways to optimize your UI.

  • Avoid overdraw: always make sure that you are not drawing too many layers on top of each other. In particular, make sure to remove any Views that are completely obscured by other opaque views on top of it. If you need to draw several layers blended on top of each other consider merging them into a single one. A good rule of thumb with current hardware is to not draw more than 2.5 times the number of pixels on screen per frame (and transparent pixels in a bitmap count!)

  • Don't create render objects in draw methods: a common mistake is to create a new Paint, or a new Path, every time a rendering method is invoked. This is not only wasteful, forcing the system to run the GC more often, it also bypasses caches and optimizations in the hardware pipeline.

  • Don't modify shapes too often: complex shapes, paths and circles for instance, are rendered using texture masks. Every time you create or modify a Path, the hardware pipeline must create a new mask, which can be expensive.

  • Don't modify bitmaps too often: every time you change the content of a bitmap, it needs to be uploaded again as a GPU texture the next time you draw it.

  • Use alpha with care: when a View is made translucent using View.setAlpha(), an AlphaAnimation or an ObjectAnimator animating the “alpha” property, it is rendered in an off-screen buffer which doubles the required fill-rate. When applying alpha on very large views, consider setting the View's layer type to LAYER_TYPE_HARDWARE.

View layers

Since Android 1.0, Views have had the ability to render into off-screen buffers, either by using a View's drawing cache, or by using Canvas.saveLayer(). Off-screen buffers, or layers, have several interesting usages. They can be used to get better performance when animating complex Views or to apply composition effects. For instance, fade effects are implemented by using Canvas.saveLayer() to temporarily render a View into a layer and then compositing it back on screen with an opacity factor.

Because layers are so useful, Android 3.0 gives you more control on how and when to use them. To to so, we have introduced a new API called View.setLayerType(int type, Paint p). This API takes two parameters: the type of layer you want to use and an optional Paint that describes how the layer should be composited. The paint parameter may be used to apply color filters, special blending modes or opacity to a layer. A View can use one of 3 layer types:

  • LAYER_TYPE_NONE: the View is rendered normally, and is not backed by an off-screen buffer.

  • LAYER_TYPE_HARDWARE: the View is rendered in hardware into a hardware texture if the application is hardware accelerated. If the application is not hardware accelerated, this layer type behaves the same as LAYER_TYPE_SOFTWARE.

  • LAYER_TYPE_SOFTWARE: the View is rendered in software into a bitmap

The type of layer you will use depends on your goal:

  • Performance: use a hardware layer type to render a View into a hardware texture. Once a View is rendered into a layer, its drawing code does not have to be executed until the View calls invalidate(). Some animations, for instance alpha animations, can then be applied directly onto the layer, which is very efficient for the GPU to do.

  • Visual effects: use a hardware or software layer type and a Paint to apply special visual treatments to a View. For instance, you can draw a View in black and white using a ColorMatrixColorFilter.

  • Compatibility: use a software layer type to force a View to be rendered in software. This is an easy way to work around limitations of the hardware rendering pipeline.

Layers and animations

Hardware-accelerated 2D graphics help deliver a faster and smoother user experience, especially when it comes to animations. Running an animation at 60 frames per second is not always possible when animating complex views that issue a lot of drawing operations. If you are running an animation in your application and do not obtain the smooth results you want, consider enabling hardware layers on your animated views.

When a View is backed by a hardware layer, some of its properties are handled by the way the layer is composited on screen. Setting these properties will be efficient because they do not require the view to be invalidated and redrawn. Here is the list of properties that will affect the way the layer is composited; calling the setter for any of these properties will result in optimal invalidation and no redraw of the targeted View:

  • alpha: to change the layer's opacity

  • x, y, translationX, translationY: to change the layer's position

  • scaleX, scaleY: to change the layer's size

  • rotation, rotationX, rotationY: to change the layer's orientation in 3D space

  • pivotX, pivotY: to change the layer's transformations origin

These properties are the names used when animating a View with an ObjectAnimator. If you want to set/get these properties, call the appropriate setter or getter. For instance, to modify the alpha property, call setAlpha(). The following code snippet shows the most efficient way to rotate a View in 3D around the Y axis:

    view.setLayerType(View.LAYER_TYPE_HARDWARE, null);
ObjectAnimator.ofFloat(view, "rotationY", 180).start();

Since hardware layers consume video memory, it is highly recommended you enable them only for the duration of the animation. This can be achieved with animation listeners:

    view.setLayerType(View.LAYER_TYPE_HARDWARE, null);
ObjectAnimator animator = ObjectAnimator.ofFloat(
view, "rotationY", 180);
animator.addListener(new AnimatorListenerAdapter() {
@Override
public void onAnimationEnd(Animator animation) {
view.setLayerType(View.LAYER_TYPE_NONE, null);
}
});
animator.start();

New drawing model

Along with hardware-accelerated 2D graphics, Android 3.0 introduces another major change in the UI toolkit’s drawing model: display lists, which are only enabled when hardware acceleration is turned on. To fully understand display lists and how they may affect your application it is important to also understand how Views are drawn.

Whenever an application needs to update a part of its UI, it invokes invalidate() (or one of its variants) on any View whose content has changed. The invalidation messages are propagated all the way up the view hierarchy to compute the dirty region; the region of the screen that needs to be redrawn. The system then draws any View in the hierarchy that intersects with the dirty region. The drawing model is therefore made of two stages:

  1. Invalidate the hierarchy

  2. Draw the hierarchy

There are unfortunately two drawbacks to this approach. First, this drawing model requires execution of a lot of code on every draw pass. Imagine for instance your application calls invalidate() on a button and that button sits on top of a more complex View like a MapView. When it comes time to draw, the drawing code of the MapView will be executed even though the MapView itself has not changed.

The second issue with that approach is that it can hide bugs in your application. Since views are redrawn anytime they intersect with the dirty region, a View whose content you changed might be redrawn even though invalidate() was not called on it. When this happens, you are relying on another View getting invalidated to obtain the proper behavior. Needless to say, this behavior can change every time you modify your application ever so slightly. Remember this rule: always call invalidate() on a View whenever you modify data or state that affects this View’s drawing code. This applies only to custom code since setting standard properties, like the background color or the text in a TextView, will cause invalidate() to be called properly internally.

Android 3.0 still relies on invalidate() to request screen updates and draw() to render views. The difference is in how the drawing code is handled internally. Rather than executing the drawing commands immediately, the UI toolkit now records them inside display lists. This means that display lists do not contain any logic, but rather the output of the view hierarchy’s drawing code. Another interesting optimization is that the system only needs to record/update display lists for views marked dirty by an invalidate() call; views that have not been invalidated can be redrawn simply by re-issuing the previously recorded display list. The new drawing model now contains 3 stages:

  1. Invalidate the hierarchy

  2. Record/update display lists

  3. Draw the display lists

With this model, you cannot rely on a View intersecting the dirty region to have its draw() method executed anymore: to ensure that a View’s display list will be recorded, you must call invalidate(). This kind of bug becomes very obvious with hardware acceleration turned on and is easy to fix: you would see the previous content of a View after changing it.

Using display lists also benefits animation performance. In the previous section, we saw that setting specific properties (alpha, rotation, etc.) does not require invalidating the targeted View. This optimization also applies to views with display lists (any View when your application is hardware accelerated.) Let’s imagine you want to change the opacity of a ListView embedded inside a LinearLayout, above a Button. Here is what the (simplified) display list of the LinearLayout looks like before changing the list’s opacity:

    DrawDisplayList(ListView)
DrawDisplayList(Button)

After invoking listView.setAlpha(0.5f) the display list now contains this:

    SaveLayerAlpha(0.5)
DrawDisplayList(ListView)
Restore
DrawDisplayList(Button)

The complex drawing code of ListView was not executed. Instead the system only updated the display list of the much simpler LinearLayout. In previous versions of Android, or in an application without hardware acceleration enabled, the drawing code of both the list and its parent would have to be executed again.

It’s your turn

Enabling hardware accelerated 2D graphics in your application is easy, particularly if you rely solely on standard views and drawables. Just keep in mind the few limitations and potential issues described in this document and make sure to thoroughly test your application!


Renderscript Part 2

[This post is by R. Jason Sams, an Android engineer who specializes in graphics, performance tuning, and software architecture. —Tim Bray]

In Introducing Renderscript I gave a brief overview of this technology. In this post I’ll look at “compute” in more detail. In Renderscript we use “compute” to mean offloading of data processing from Dalvik code to Renderscript code which may run on the same or different processor(s).

Renderscript’s Design Goals

Renderscript has three primary goals, given here from most to least important.

Portability: Application code needs to be able to run across all devices, even those with radically different hardware. ARM currently comes in several variants — with and without VFP, with and without NEON, and with various register counts. Beyond ARM, there are other CPU architectures like x86, several GPU architectures, and even more DSP architectures.

Performance: The second objective is to get as much performance as possible within the constraints of Portability. For Renderscript to make sense we need to achieve much greater performance than established solutions.

Usability: The third goal is to simplify development as much as possible. Where possible we automate steps to avoid glue code and other developer busy work.

Those three goals lead to several design trade-offs. It’s these trade-offs that separate Renderscript from the existing approaches on the device, such as Dalvik or the NDK. They should be thought of as different tools intended to solve different problems.

Core Design Choices

The first choice that needed to be made is what language should be used. When it comes to languages there are almost unlimited options. Shading style languages, C, and C++ were considered. In the end the shading style languages were ruled out due to the need to be able to manipulate data structures for graphical applications such as scene graphs. The lack of pointers and recursion were considered crippling limitations for usability. C++ on the other hand was very desirable but ran into issues with portability. The advanced C++ features are very difficult to run on non-cpu hardware. In the end we chose to base Renderscript on C99 because it offers equal performance to the other choices, is very well understood by developers, and poses no issues running on a wide range of hardware.

The next design trade-off was work flow. Specifically we focused on how to convert source code to machine code. We explored several options and actually implemented two different solutions during the development of Renderscript. The older versions (Eclair through Gingerbread) compiled the C source code all the way to machine code on the device. While this had some nice properties such as the ability for applications to generate source on the fly it turned out to be a usability problem. Having to compile your app, install it, run it, then find your syntax error was painful. Also the weaker CPU in devices limited the static analysis and scope of optimizations that could be done.

Then we switched to LLVM, moving to a model where scripts are compiled and analyzed on the host using a modified version of clang. We perform high level optimizations at this stage, then emit LLVM bitcode. The translation of the intermediate bitcode to machine code still happens on the device (along with additional device-specific optimizations).

Our last big trade-off for compute was thread launching. The trade-off here is between performance and portability. Given sufficient knowledge, existing compute solutions allow a developer to tune an application for a specific hardware platform to the detriment of others. Given unlimited time and resources developers could tune for every hardware combination. While testing and tuning a variety of devices is never bad, no amount of work allows them to tune for unreleased hardware they don’t yet have. A more portable solution places the tuning burden on the runtime, providing greater average performance at the cost of peak performance. Given that the number one goal was portability we chose to place this burden on the runtime.

A secondary effect of choosing runtime thread-launch management is that dynamic decisions can be made about where to run a script. For example, some compute hardware can support pointers and recursion while others cannot. We could have chosen to disallow these things and give developers a lowest common denominator API, but we chose to instead let the runtime analyze the scripts. This allows developers to get full use of hardware that supports these features, since there is always a fully featured CPU to fall back upon. In the end, developers can focus on writing good apps and the hardware manufacturers can compete on making the most fully featured and efficient hardware. As new features appear, applications will benefit without application code changes.

Usability was a major driver in Renderscript’s design. Most existing compute and graphics platforms require elaborate glue logic to tie the high performance code back to the core application code. This code is very bug prone and usually painful to write. The static analysis we do in the host Renderscript compiler is helpful in solving this issue. Each user script generates a Dalvik “glue” class. Names for the glue class and its accessors are derived from the contents of the script. This greatly simplifies the use of the scripts from Dalvik.

Example: The Application Level

Given these trade-offs, what does a simple compute application look like? In this very basic example we will take a normal android.graphics.Bitmap object and run a script that copies it to a second bitmap, converting it to monochrome along the way. Let’s look at the application code which invokes the script before we look at the script itself; this comes from the HelloCompute SDK sample:

    private Bitmap mBitmapIn;
private Bitmap mBitmapOut;
private RenderScript mRS;
private Allocation mInAllocation;
private Allocation mOutAllocation;
private ScriptC_mono mScript;

private void createScript() {
mRS = RenderScript.create(this);

mInAllocation = Allocation.createFromBitmap(mRS, mBitmapIn,
Allocation.MipmapControl.MIPMAP_NONE,
Allocation.USAGE_SCRIPT);
mOutAllocation = Allocation.createTyped(mRS, mInAllocation.getType());

mScript = new ScriptC_mono(mRS, getResources(), R.raw.mono);

mScript.set_gIn(mInAllocation);
mScript.set_gOut(mOutAllocation);
mScript.set_gScript(mScript);
mScript.invoke_filter();
mOutAllocation.copyTo(mBitmapOut);
}

This function assumes that the two bitmaps have already been created and are of the same size and format.

The first thing all Renderscript applications need is a context object. This is the core object used to create and manage all other Renderscript objects. This first line of the function creates the object, mRS. This object must be kept alive for the duration the application intends to use it or any objects created with it.

The next two function calls create compute allocations from the Bitmaps. Renderscript has its own memory allocator, because the memory may potentially be shared by multiple processors and possibly exist in more than one memory space. When an allocation is created its potential uses need to be enumerated so the system may choose the correct type of memory for its intended uses.

The first function createFromBitmap() creates a matching Renderscript allocation object and copies the contents of the bitmap into the allocation. Allocations are the basic units of memory used in renderscript. The second Allocation created with createTyped() generates an Allocation identical in structure to the first. The definition of that structure is retrieved from the first with the getType() query. Renderscript types define the structure of an Allocation. In this case the type was generated from the height, width, and format of the incoming bitmap.

The next line loads the script, which is named “mono.rs”. R.raw.mono identifies it; scripts are stored as raw resources in an application’s APK. Note the name of the auto-generated “glue” class, ScriptC_mono.

The next three lines set properties of the script, using generated methods in the “glue” class.

Now we have everything set up. The function invoke_filter() actually does some work for us. This causes the function filter() in the script to be called. If the function had parameters they could be passed here. Return values are not allowed as invocations are asynchronous.

The last line of the function copies the result of our compute script back to the managed bitmap; it has the necessary synchronization code built-in to ensure the script has completed running.

Example: The Script

Here’s the Renderscript stored in mono.rs which the application code above invokes:

#pragma version(1)
#pragma rs java_package_name(com.android.example.hellocompute)

rs_allocation gIn;
rs_allocation gOut;
rs_script gScript;

const static float3 gMonoMult = {0.299f, 0.587f, 0.114f};

void root(const uchar4 *v_in, uchar4 *v_out, const void *usrData, uint32_t x, uint32_t y) {
float4 f4 = rsUnpackColor8888(*v_in);

float3 mono = dot(f4.rgb, gMonoMult);
*v_out = rsPackColorTo8888(mono);
}

void filter() {
rsForEach(gScript, gIn, gOut, 0);
}

The first line is simply an indication to the compiler which revision of the native Renderscript API the script is written against. The second line controls the package association of the generated reflected code.

The three globals listed correspond to the globals which were set up in our managed code. The fourth global is not reflected because it is marked as static. Non-static, const, globals are also allowed but only generate a get reflected method. This can be useful for keeping constants in sync between scripts and managed code.

The function root() is special to renderscript. Conceptually it’s similar to main() in C. When a script is invoked by the runtime, this is the function that will be called. In this case the parameters are the incoming and outgoing pixels from our allocation. A generic user pointer is also provided along with the address within the allocation that this invocation is processing. This example ignores these parameters.

The three lines of the root function unpack the pixel from RGBA_8888 to a vector of four floats. The second line uses a built-in math function to compute the dot product of the monochrome constants with the incoming pixel data to get our grey level. Note that while dot returns a single float it can be assigned to a float3 which simply copies the value to each of the x, y, and z components of the float3. In the end we use another builtin to repack the floats back to a 32 bit pixel. This is also an example of an overloaded function as there are separate versions of rsPackColorTo8888 which take RGB (float3) or RGBA (float4) data. If A is not provided the overloaded functions assume a value of 1.0f.

The filter() function is called from managed code to do the conversion. It simply does a compute launch on each element of the allocation. The first parameter is the script to be launched - the root function of this script will be invoked for each element in the allocation. The second and third parameters are the input and output data allocations. The last parameter is the pointer for the user data if we desired to pass additional information to the root function.

The forEach will launch across multiple threads if the device has multiple processors. In the future forEach can provide a transition point where control may pass from one processor to another. In this example it is reasonable to expect that in the future filter() would get executed on the CPU and root() would occur on a GPU or DSP.

I hope this gives glimpse into the design behind Renderscript and a simple example of how it can be used.

Fragments For All

[This post is by Xavier Ducrohet, Android SDK Tech Lead. — Tim Bray]

A few weeks ago, Dianne Hackborn wrote about the new Fragments API, a mechanism that makes it easier for applications to scale across a variety of screen sizes.

However, as Dianne noted, this new API, which is part of Honeycomb, does not help developers whose applications target earlier versions of Android.


Today we’ve released a static library that exposes the same Fragments API (as well as the new LoaderManager and a few other classes) so that applications compatible with Android 1.6 or later can use fragments to create tablet-compatible user interfaces.

This library is available through the SDK Updater; it’s called “Android Compatibility package”.